Overview |
|
|
This page contains a short description of the SPuNC method. Detailed information can be found in the manuscript. Given an alignment of related RNA sequences that presumably fold into the same structure, the algorithm performs the following steps.
| |
Ensemble generation | |
|
Currently RNAsubopt from the Vienna RNA package is used to generate an ensemble
of candidate structures. In the paper, we randomly sample a thousand structures
(RNAsubopt -p) for each alignment and remove duplicates from the set. The true structure is not necessarily
present in this set. The web interface offers three methods:
| |
Scoring function | |
The scoring function assigns a score to each candidate structure for the alignment, reflecting its
ability to reproduce the compositional patterns observed in biological structures. The scoring
function considers five compositional properties:
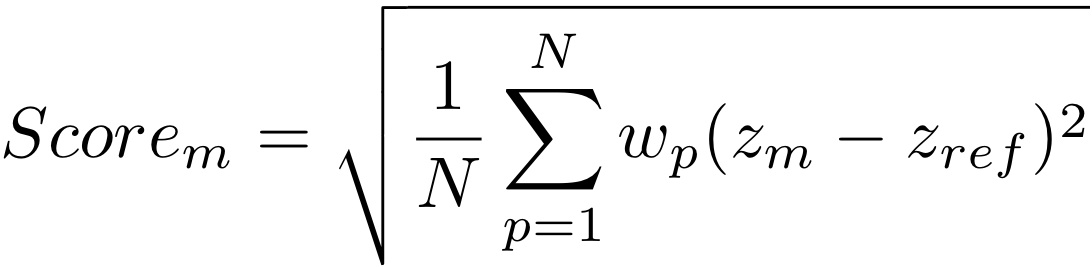 Thus, for a given sequence alignment and ensemble of candidate structures, we first calculate the distribution of values for each property p (five in this case) in the ensemble. Subsequently, for each ensemble member m and for each property p, we calculate the Z-score of the member (zm). We then sum the squared distance of zm to the reference Z-score for the property (zref) weighted by wp over all properties. Finally, we take the mean and the square root of this sum. See the manuscript for a more detailed explanation. | |
Consensus calculation | |
| A consensus structure contains the most reliable base pairs from a set of structures. The first step is to list the frequency of occurrence of each base pair in the set of structures. The consensus structure contains all base pairs that occur with a certain frequency or higher as determined by the "base-pair cutoff" (bp-cutoff). Eligible base pairs are added to the consensus structure one by one from high to low frequency if both the 5' and 3' position are not in the consensus yet. In this way the consensus structure is free of conflicts, i.e. each base interacts with at most one other base, but might include pseudoknots. | |