
 |
 |
|
||||||||||
 |


 |
||
BICEP Information |
BICEP description
BICEP Synopsis
Differential Scanning Calorimetry (DSC) is a widely used experimental technique to investigate folding transitions of proteins by measuring the heat capacity with respect to the temperature. Experimental observations show that native proteins have a linear increase in their heat Capacity versus temperature curve [1-3] (for an example, see Figure 1). Recently, we showed that these baselines can be estimated accurately by taking the exposed hydrophobic surface area of the protein structure into account [4]. Heat capacity measurements can be used together with theoretical models to determine if a protein is folded or partially denatured at a given temperature [3]; having an accurate theoretical prediction for the baseline can considerably help interpretation of the results.
Here we present the BICEP server, that implements two methods to predict these baselines: The Freire baseline [1], based on the molecular weight of the protein, and our recently developed method based on the Hydrophobic Surface Area (HSA) of the protein in ref. [4].
The mathematical form of the baseline, along with the calculated HSA and molecular weight are shown to the user. We allow users to upload and compare their data to these baselines. We show in two separate use cases (PDD and SRY) how to the output may be used to interpret experimental baselines and compare the findings to earlier interpretations [3, 5].
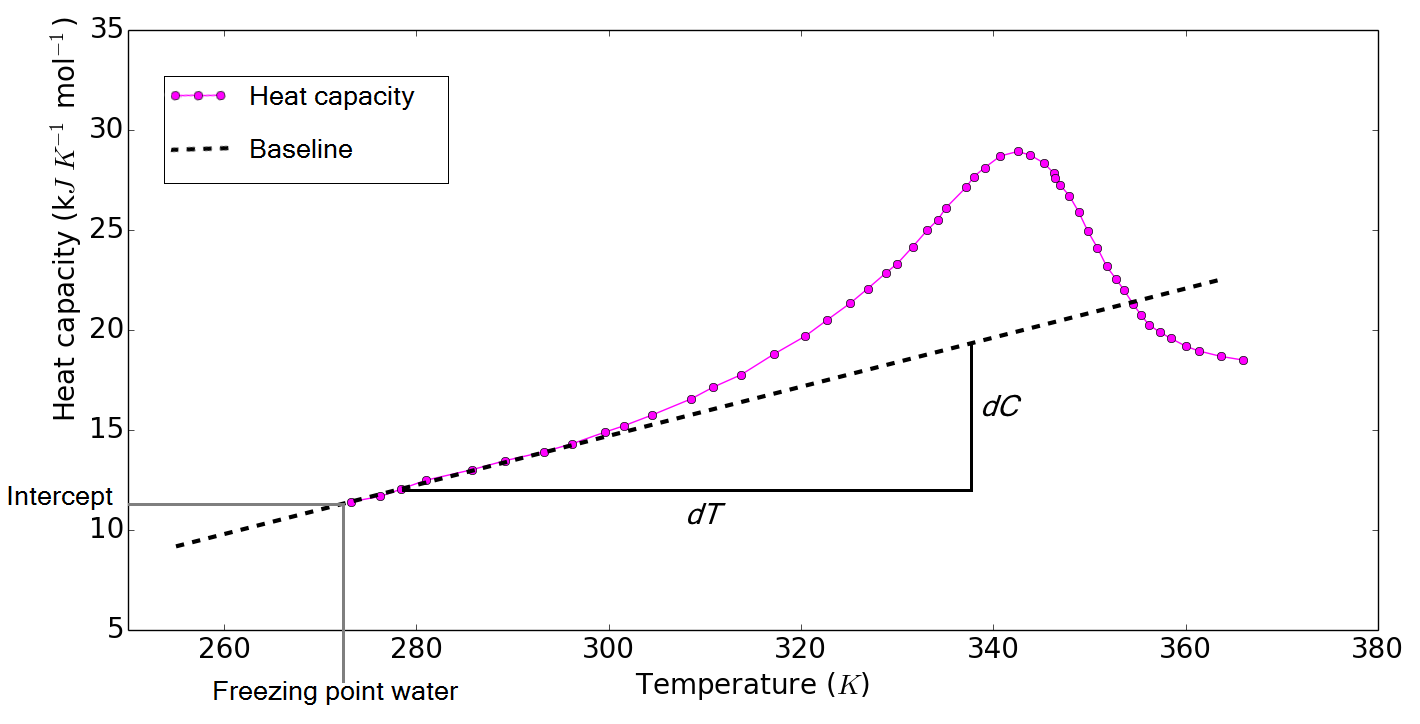 Figure 1: Example of a DSC define DSC experiment where the heat capacity was measured for a range of different temperatures. Three regions can be observed in this plot. For low temperatures the protein is in a native state. In this region, the T-heat capacity relation is approximately linear (The increase in the baseline of the heat capacity is illustrated by a dotted line). At intermediate temperatures, the heat capacity shows a sharp peak. At high temperatures, the heat capacity follows the heat capacity of the unfolded state. Reproduced from ref. [6].
Server calculations
The webserver analyses the input PDB file and runs DSSP CMBI version November 18 in 2002 [7]. Only the user specified chains are used in the calculation. The following equation is used:
\begin{equation} \begin{split} HSA = \sum_{h_i \in N}^{} g(h_i) \\ N = \{A,F,C,L,I,W,V,M,Y\} \end{split} \label{sumHSA} \end{equation}
The HSA is calculated by summing over the accessible surface area of all amino acids in a chain if it is part of the hydrophobic set of amino acids ($N$). An interaction potential is used to define the set of hydrophobic amino acids ($N$) as in ref. [8]. The function $g$ returns the accessible surface area for a specific amino acid. MatplotLib creates the figure that shows the baseline increase in heat capacity [9]. PyMOL is used to visualize the protein with the hydrophobic residues coloured red and the remaining residues blue [10].The HSA calculation is performed using eqn. \eqref{sumHSA}. The baseline can be described by a simple linear formula: \begin{equation} \label{simpleLinForm} C=a\cdot (273.15-T) + b \end{equation} where $C$ is the heat capacity in $J $mol$^{-1} K^{-1}$, $T$ the temperature in Kelvin, $a$ the slope of the baseline ($\frac{dC}{dT}$) and $b$ the intercept (Figure 1). The intercept of the proteins that were used during the fitting procedure of the above formula are measured at 0 $^\circ$C [2]. For the Freire baseline, eqn \eqref{simpleLinForm} can be written as: \begin{equation} \label{freireFormula} C=k_{slope,freire} \cdot M_{\text{weight}} (273.15-T) + k_{intercept,freire} \cdot M_{\text{weight}} \end{equation} Here, $M_{\text{weight}}$ is the molecular weight in $u$. In ref. [1], the constants $k_{slope,freire}$ and $k_{intercept,freire}$ were fitted to 0.0067 and 1.323 respectively. The HSA baseline can be written as: \begin{equation} \label{bicepFormula} C=k_{slope,hsa} \cdot HSA (273.15-T) + k_{intercept,hsa} \cdot M_{\text{weight}} \end{equation} Here, the HSA is calculated as in eqn. \eqref{sumHSA}. The constants $k_{slope,hsa}$ and $k_{intercept,hsa}$ are fitted to 0.090 and 1.31, respectively.
BICEP input
BICEP is straightforward to use:
- Provide a Protein Data Bank (PDB) file as input. Supply a PDB identifier or upload your own structure in PDB text format.
- The Freire baseline can be calculated and plotted by checking the likewise named checkbox
- Optionally, select a chain. Note, that chain selection is required if your structure contains non-protein chains, such as DNA or RNA. If no chains are specified the entire structure will be used. Selecting multiple chains is done by entering chains IDs sequentially in the chain input field without a separation character.
- Optionally, experimental data can be visualized in the output plot by uploading a heat capacity profile. This should be a tab-delimited file, tab-delimited file where the first two columns should be temperature in Kelvin and heat capacity in $kJ$ mol$^{-1} K^{-1}$. All lines starting with a "#" are ignored. See the example file.
- Optionally, the baseline equation can be set to go through a fixed point in the graph. The given temperature should be in Kelvin and the heat capacity in $kJ$ mol$^{-1} K^{-1}$.
Clicking "Run" starts the computation. This may take some time; the self-updating web page gives information about the status of the computation.
BICEP output
See the example output for an illustration. Note that the example can always be generated in real-time by clicking "rerun the example" on the input page.
The output consists of the HSA, the molecular weight, and the equation for the baseline. The equation for the baseline is returned in the following format: \begin{equation} C=a\cdot \pm \sigma_s (273.15-T) + b \pm \sigma_i \end{equation} here, $T$, $a$ and $b$ are described above. The heat capacity $C$ is in $J $mol$^{-1} K^{-1}$. The $\sigma_s$ and $\sigma_i$ after the $\pm$ sign show the standard deviation of the slope and intercept respectively.
Graphic output includes a figure with the baselines plotted with, optionally, the experimental data. In addition, the hydrophobic amino acids are visualized for the protein using static images (PyMOL) and the JSmol browser-based HTML5 viewer. The PyMOL-generated images are provided as an alternative. For more details about the calculations see Server Calculations. The output is further illustrated using the PDD and SRY proteins.
Downloads
All produced images and DSSP output files are available for download.Use case PDD
PDD fast folding protein
The fast folding protein PDD (PDB identifier: 2PDD) is frequently used in folding studies and models because of its fast folding property and small size [5]. Two separate experimental techniques to determine secondary structure suggest that the protein gradually unfolds from 280K to 350K [5,11].
Freire baseline PDD fast folding protein
The heat capacity obtained through DSC-experiments was higher and steeper sloped than would be expected from Freire's baseline. This supports the hypothesis that the protein gradually unfolds. The Freire baseline is shown in formula form in the output page: \begin{equation} C = 30.69\pm 13\cdot (273.15 - T) + 6060\pm 540 \end{equation}
BICEP baseline PDD
The HSA-based method returns the following equations for the PDD protein: \begin{equation} C = 107.68\pm 18.9 \cdot (273.15 - T) + 6000\pm 1353 \end{equation} In contrast to Freire's baseline, the HSA-based method does seem to predict the slope and intercept of the heat capacity well (Figure 2). The denaturation peak of the protein is inside the error bars for the HSA-based method. This supports the hypothesis presented in ref. [5,11] that the protein structure unfolds gradually between 280K and 350K.
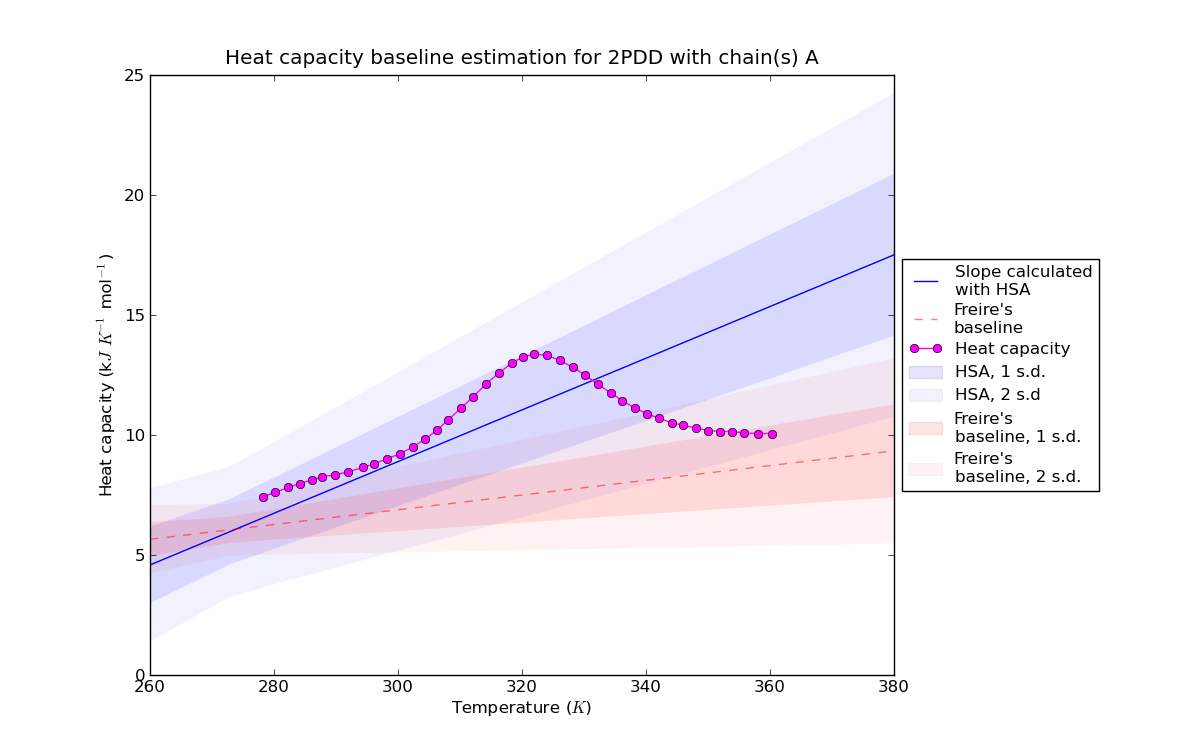 Figure 2: Baseline estimation for PDD (PDB identifier: 2PDD) with the HSA slope based method and Freire baseline [12]. One and two standard deviations are indicated by shaded areas of different opacity.
Visualization PDD
The protein has a relatively large HSA in the PDB-structure (Figure 3), which explains why the HSA-based method predicts a large slope for the baseline. Investigation of the protein structure, along with the absence of long range NOEs for the terminal regions indeed shows that the terminal regions are largely unstructured [12].
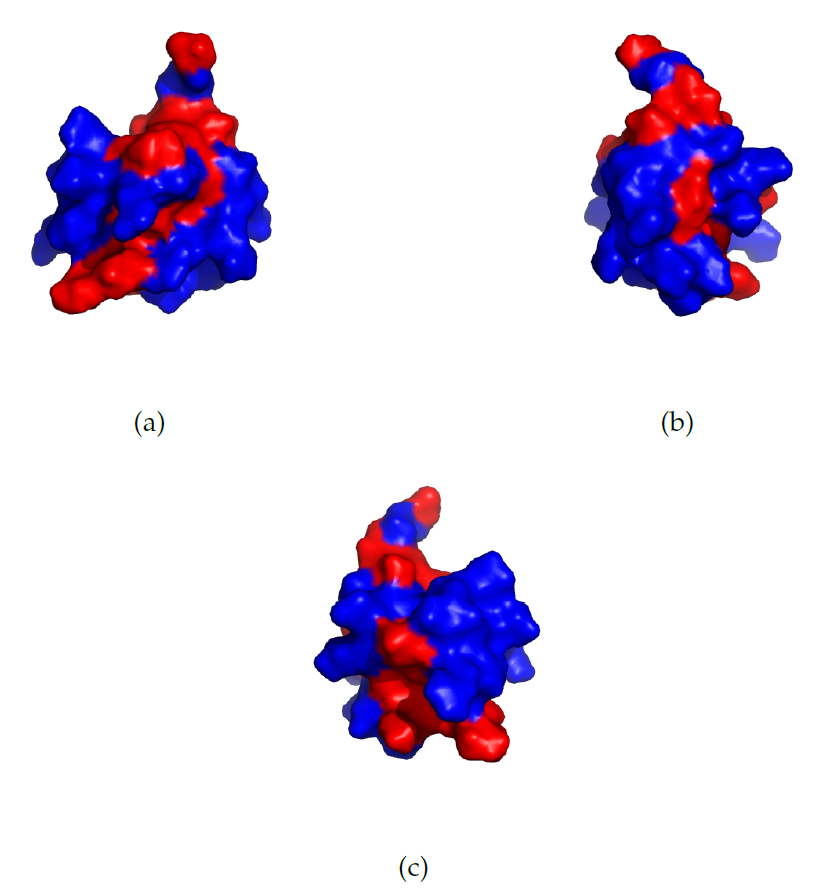 Figure 3: The structure of the PDD (PDB identifier: 2PDD) protein. From NMR-measurements it can be concluded that the terminal regions are largely unstructured [12]. The Hydrophobic Surface Area visualized for the SRY protein with the PDB identifier 1J46, viewed from three different angles. The hydrophobic amino acids are coloured in red and the remaining in blue. The set of hydrophobic amino acids, $N$, is defined in eqn. \eqref{sumHSA}. The protein is turned with $0^\circ$, $120^\circ$ and $240^\circ$ for (a), (b) and (c) respectively.
Use case SRY
SRY DNA binding protein
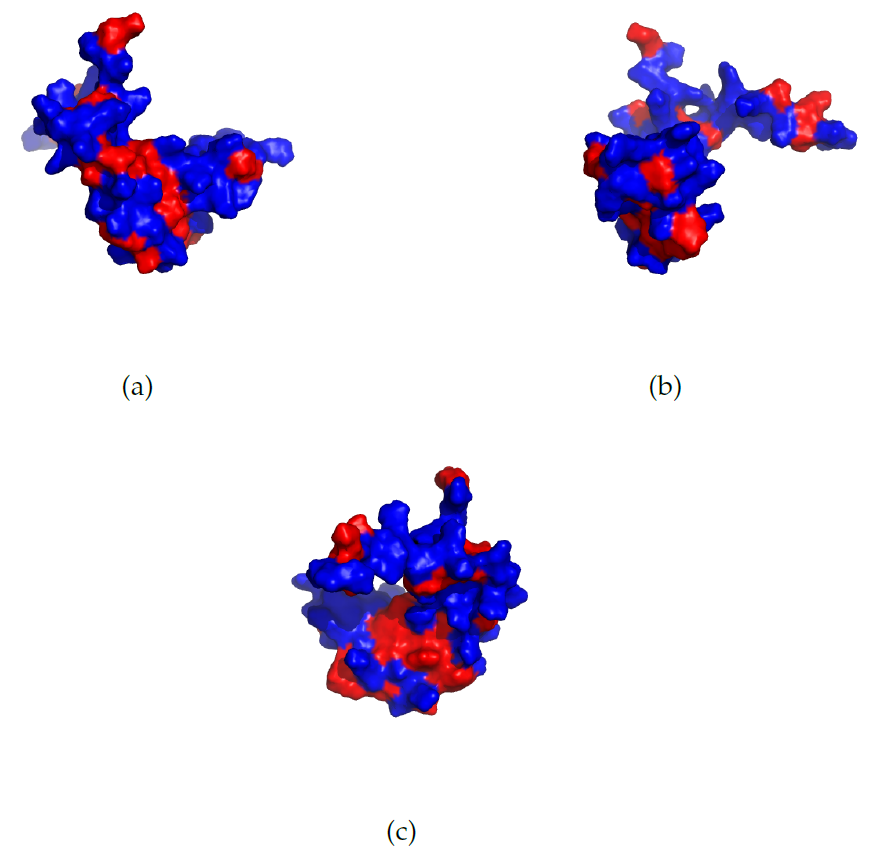
The human male sex-determining factor SRY (PDB identifier: 1J46) is a DNA binding protein. The slope of the heat capacity for DNA-binding proteins is higher than one would expect based on Freire's baseline [2,3]. The protein is visualized in Figure 4. The experimental data for SRY was taken from ref. [13].
SRY DNA binding protein baselines
Freire's baseline predicts the following baseline for the SRY-protein: \begin{equation} C = 71.12\pm 13 \cdot (273.15 - T) + 14044\pm 540 \end{equation} The HSA-based method yields the following equation for the SRY protein: \begin{equation} C = 210.22\pm 18.9 \cdot (273.15 - T) + 13025\pm 1353 \end{equation} As is the case for most DNA-binding proteins the slope of the heat capacity is higher than the estimate given by Freire's baseline. The fit derived in ref. [4], which is valid for both DNA-binding and globular proteins, yields a better fit for this protein.
SRY DNA binding protein heat capacity plot
The results for the SRY protein without DNA chains are visualized in Figure 5a. The baselines for HSA slope-based estimation and Freire's are plotted with two standard deviations and experimental data. Figure 5a shows that, similar to the PDD use case, the unfolding of the protein is inside the error estimates for the HSA-based method. This suggests that this protein unfolds gradually when the temperature is increased. Ellipticity measurements support this hypothesis [13].
Fixing the heat capacity to a certain temperature
The PDB-file shows that the structure for SRY was determined at 308K. We know that the heat capacity is correct for the structure determined at this temperature. Therefore, it makes sense to focus on the slope of the heat capacity to investigate if the protein unfolds gradually with increasing temperature. This can be done in the server by fixing the heat capacity estimate at a reference point (Figure 5b). The slope is accurately estimated by the HSA-based method, and the denaturation peak falls outside the margin of error. This means that changes in the structure are not required to explain the steep slope in the heat capacity for this protein. The poor fit of the Freire baseline does suggest that the protein is partially disordered for all temperatures below 308K.
Figure 4: The Hydrophobic Surface Area visualized for the SRY protein with the PDB identifier 1J46, viewed from three different angles. The hydrophobic amino acids are coloured in red and the remaining in blue. The set of hydrophobic amino acids, $N$, is defined in eqn. \eqref{sumHSA}. The protein is turned with $0^\circ$, $120^\circ$ and $240^\circ$ for (a), (b) and (c) respectively.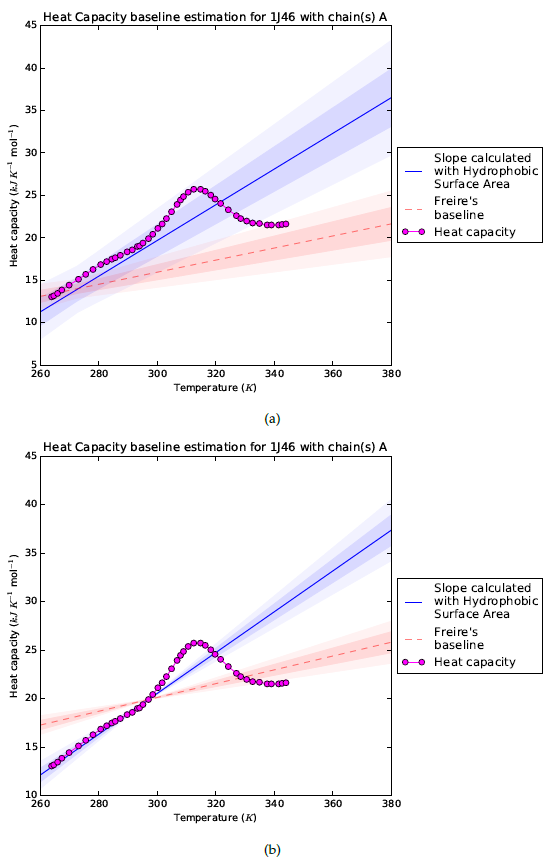 Figure 5: Baseline estimation for SRY (PDB identifier: 1J46) with the HSA slope based method and Freire baseline [14]. The first and second standard deviation are plotted with a different opacity in (a). In (b) the intercept was fixed at 298 K with the corresponding heat capacity, only the slope standard deviation is plotted because the assumption is made that the intercept is correct.
References:
- Javier Gomez, Vincent J Hilser, Dong Xie, and Ernesto Freire. The heat capacity of proteins. Proteins: Structure, Function, and Bioinformatics, 22(4):404-412, 1995.
- Peter L Privalov and Anatoly I Dragan. Microcalorimetry of biological macromolecules. Biophysical Chemistry, 126(1):16-24, 2007.
- Athi N Naganathan, Raűl Perez-Jimenez, Victor Muňoz, and Jose M Sanchez-Ruiz. Estimation of protein folding free energy barriers from calorimetric data by multi-model bayesian analysis. Physical Chemistry Chemical Physics, 13(38):17064-17076, 2011.
- Erik van Dijk, Patrick Varilly, Tuomas Knowles, Daan Frenkel, and Sanne Abeln. Consistent treatment of hydrophobicity in protein lattice models accounts for cold denaturation. Physiscal Review Letters (accepted).
- Athi N Naganathan and Victor Muňoz. Thermodynamics of downhill folding: Multi-probe analysis of pdd, a protein that folds over a marginal free energy barrier. The Journal of Physical Chemistry B, 118(30):8982-8994, 2014.
- Peter L Privalov, Ilian Jelesarov, Christopher M Read, Anatoly I Dragan, and Colyn Crane-Robinson. The energetics of HMG box interactions with DNA: thermodynamics of the DNA binding of the HMG box from mouse sox-5. Journal of Molecular Biology, 294(4): 997-1013, 1999.
- Wolfgang Kabsch and Christian Sander. Dictionary of protein secondary structure: pattern recognition of hydrogen-bonded and geometrical features. Biopolymers, 22(12):2577-2637, 1983.
- Sanne Abeln and Daan Frenkel. Accounting for protein-solvent contacts facilitates design of nonaggregating lattice proteins. Biophysical journal, 100(3):693-700, 2011.
- John D Hunter. Matplotlib: A 2d graphics environment. Computing in Science & Engineering, 9(3):0090-95, 2007.
- Warren L DeLano. The PyMOL molecular graphics system. 2002.
- Athi N Naganathan, Peng Li, Raűl Perez-Jimenez, Jose M Sanchez-Ruiz, and Victor Muňoz. Navigating the downhill protein folding regime via structural homologues. Journal of the American Chemical Society, 132(32):11183-11190, 2010.
- Yogeshvar N Kalia, Simon M Brocklehurst, Deborah S Hipps, Ettore Appella, Kazuyasu Sakaguchi, and Richard N Perham. The high-resolution structure of the peripheral subunit-binding domain of dihydrolipoamide acetyltransferase from the pyruvate dehydrogenase multienzyme complex of Bacillus stearothermophilus. Journal of Molecular Biology, 230(1):323-341, 1993.
- Anatoly I Dragan, Christopher M Read, Elena N Makeyeva, Ekaterina I Milgotina, Mair EA Churchill, Colyn Crane-Robinson, and Peter L Privalov. DNA binding and bending by HMG boxes: energetic determinants of specificity. Journal of molecular biology, 343(2):371-393, 2004.
- Elizabeth C Murphy, Victor B Zhurkin, John M Louis, Gabriel Cornilescu, and G Marius Clore. Structural basis for SRY-dependent 46-X, Y sex reversal: modulation of DNA bending by a naturally occurring point mutation. Journal of Molecular Biology, 312(3):481-499, 2001.
(c) IBIVU 2025. If you are experiencing problems with the site, please contact the webmaster.