
 |
 |
|
||||||||||
 |


 |
||
Scooby doc |
Scooby-domain (Sequence hydrophobicity predicts domains) is a fast and simple method to identify globular domains in protein sequence, based on the observed lengths and hydrophobicities of domains from proteins with known tertiary structure. The prediction method successfully identifies sequence regions that will form a globular structure and those that are likely to be unstructured. The method does not rely on homology searches and, therefore, can identify previously unknown domains for structural elucidation. Scooby-domain is available as a Java applet (version 1.0). It may be used to visualise local properties within a protein sequence such as average hydrophobicity, secondary structure propensity and domain boundaries, as well as being a method for fast domain assignment of large sequence sets.
Scooby-domain home
Distribution of domain size and average hydrophobicity
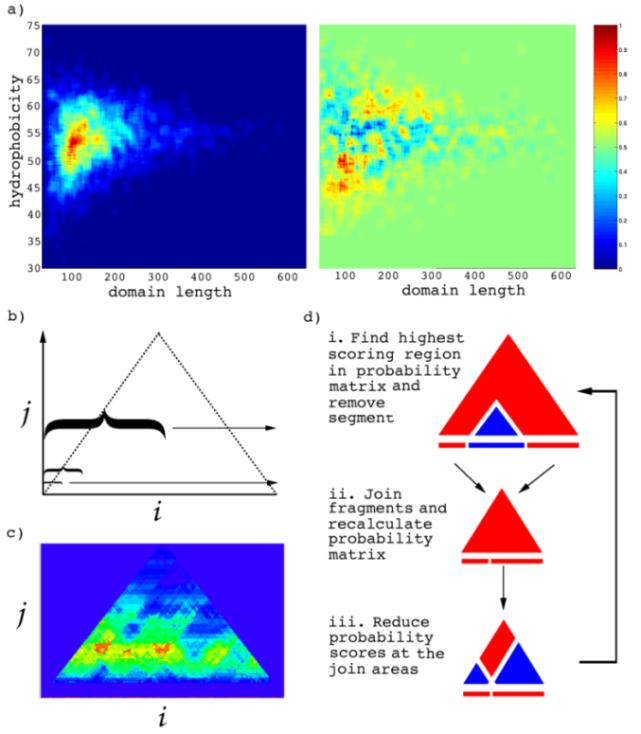
Figure 1a shows the 3D histogram of average hydrophobicity and domain length distributions for the CATH domains. There are clear limits to the number of hydrophobic residues within a domain depending on its sequence length. Figure 1a also shows how the average hydrophobic and length distributions are very different to those measured for a set of sequences with a random selection of residues from the CATH domains. Shorter domain sequences, less than 100 residues, require a smaller proportion of hydrophobic residues than larger domains. This follows the rules that there must be a limit to the number of non-polar residues so that they can be completely protected from the solvent exterior by a fixed shell of polar residues. Larger domains have a larger proportion of hydrophobic residues, which levels out at 55% where domains become larger than 200 residues.
Generating a domain probability matrix for a query sequence
Scooby-domain uses a multilevel smoothing window to predict the location of domains in a novel sequence (Figure 1b). The window size, representing the length of a putative domain, is incremented starting from the smallest domain size observed in the database to the largest domain size. Each smoothing window calculates the fraction of hydrophobic residues it encapsulates along a sequence, and places the value at its central position. This leads to a 2D matrix, where the value at ij is the average hydrophobicity encapsulated by a window of size j that is centred at residue position i. The matrix has a triangular shape, the apex of which will correspond to a window size equal to the length of the sequence or the maximum window size (largest observed domain).
All values in the matrix are converted into probability scores by referring to the observed distribution of domain sizes and hydrophobicities described earlier, i.e. given an average hydrophobicity and window length the probability that it can fold into a domain is found directly from the observed data. Visualisation of the Scooby plots can be used to effectively identify regions that are likely to fold into domains, as well as unstructured regions (Figure 1c).
Automatic domain boundary assignment
The highest probability in the Scooby plot represents the first predicted domain (Figure 1d). The corresponding sequence stretch for this domain is removed from the sequence. Therefore, the first predicted domain will always have a continuous sequence and further domain predictions can encompass discontinuous domains. If the excised domain is at a central position in the sequence, the resulting N- and C-terminal fragments are rejoined and the probability matrix recalculated as before. The second highest probability is then found and the corresponding subsequence removed. The process is repeated until there are less than 30 residues left from the original sequence, the size of the smallest domain, or there are no probabilities greater than 0.33 in the matrix to avoid error prone predictions.
Figure 1 (a) Histogram of CATH domains as a function of their hydrophobicity and domain length. The colour bar to the right of the figure shows the scale of the distribution (0 to 1): red areas represent regions that have a high frequency of domain occurrence. The second plot shows the average CATH domain hydrophobicity minus the average hydrophobicity for randomised sequences (generated from a random selection of residues from sequences in the CATH database). (b) Multilevel smoothing window. The horizontal axis corresponds to the sequence position, i, and the vertical axis represents the window length used in the smoothing of sequence hydrophobicity, j. Each position in the matrix corresponds to the average hydrophobicity assigned to the centre of a window during smoothing. (c) Each position in the matrix is converted to a probability that it will fold into a domain, based on the lengths and hydrophobicities observed in the distribution of CATH domains. (d) i. The highest scoring window (first predicted domain) is identified in the probability matrix and the sequence region it encapsulates (blue triangle) is removed from the sequence. ii. The resulting sequence fragments are rejoined and the probability matrix recalculated. iii. The smoothing windows that encapsulate the last 15 residues of the N-terminal fragment and the first 15 residues of the C-terminal fragment have their probabilities set to zero (white bands). If the next highest scoring region is found in the red region then the excised domain will be discontinuous, otherwise it will be continuous.
Download Scooby binaries...
ScoobyDo.bin for Linux.
ScoobyDo.exe for Windows.
How to use Scooby-Domain with the command line?
The program requires a fasta sequence file as the first argument (eg ./ScoobyDo_linux 2pia.seq). The program will print out ten results ranked by score (score is in brackets). If you just want one prediction for a sequence, you could take the first prediction which will have number (rank) 0, see below.
 >0-0(0.742)   114   231
 >1-6(0.742)   113   226
 >2-2(0.557)    95   204   234
 >3-7(0.538)   113   232
 >4-8(0.538)   104   223
 >5-5(0.497)   130   197   296
 >6-4(0.407)   137   199   296
 >7-9(0.403)    94   213   240
 >8-1(0.325)    34   104   213   240
 >9-3(0.325)    39   146   199   296
Each number following the score, in brackets, is a predicted domain boundary. The first number after the '>' is rank of the prediction. Rank 0 is the best prediction to use, followed by rank 1 and so on. The second number after the '-' sign is the prediction number. It represents the order in which the prediction is produced from the algorithm, and it does not indicates the benchmarked quality of the prediction.
The produced *.out file gives each residue position a domain number for each prediction, so you can keep track of discontinuous domains. The produced *.dom file is similar to the *.out file. Each domain is marked with a letter from 'a-z' in small cap. Each 'U' represents possible linker regions that are unstructured. These regions are not likely to be part of the hydrophobic core of domains.
The *.ps file is a postscipt file (not always printed correctly) showing a probability matrix (Figure 1c). Each hot spot represents a central region along the sequence that will fold into a domain.
How to use linker prediction scores?
The command line usage for the use of linker prediction socres is:
./ScoobyDo [input sequence in fasta mode] [DOMCUT or DOMCUT_B] [optional: file name with linker scores]
DOMCUT_B = Use Domcut on first sequence only (recommended)
DOMCUT = Use DomCut on all sequences
Instead of using DomCut, you may use your own linker prediction scores via an input file: The input file1 1.98609687084548 2 1.77344019624752 3 1.78786992621695 4 1.36715273915053 5 1.20387679635056 6 1.33729683458531 7 0.71342730104684 8 0.851118053061024 9 0.732165206833348 10 0.552918905787393 11 0.299159313296559 ....etc....The first column of each line is the amino acid residue position, the second column is the linker score. The higher the score is for an amino acid position, the more likely it is a linker. The columns are separated by a tab. If DomCut is used, two files *.domcut and *.dcs will be produced. The *.domcut file records the linker score for each position along the query protein sequence. The *.dcs file record the linker positions predicted by DomCut.
(c) IBIVU 2025. If you are experiencing problems with the site, please contact the webmaster.